One week back....
I have been working on Power BI for a long time now, although power bi is easy to use and have monthly releases, what frustrates me is the lack of charts which other reporting tool have, for example highcharts, D3 have so many visualization. So I was looking for an option to add custom charts into dashboard as we are working on reports for streaming data. I came across documents which provided the way to integrate third party charts in power bi. This was a very nice feature considering the wide variety of charts coming up in the market till the time Power BI catches up with the competition.
In this blog I will be adding highcharts into powerbi report. Why highcharts? Well of all the charting libraries I have come across, highcharts have the best repository of charts, further you can easily incorporate the charts into your web page. Further you can see that they are actively evolving the library to provide rich visualization to the end users.
Now, let's see how to add highcharts into power bi, It will involve three main sections:
1) Environment setup
2) Coding to add highcharts
3) Testing the visualization on the powerbi report.
1) Environment setup:
To set up the environment for custom visualization you can refer to the microsoft site <https://docs.microsoft.com/en-us/power-bi/developer/custom-visual-develop-tutorial#setting-up-the-developer-environment> or you can follow me here.
This requires the below tools -
a) Installation of nodejs
b) pbiviz library installation
c) Installing certificate
d) creating project and opening it via visual studio code
a) Installation of nodejs -
To install nodejs go to the link - nodejs and download either the latest build or the LTS as shown in the image below. In my case I am going for the LTS for windows 64 bit environment.
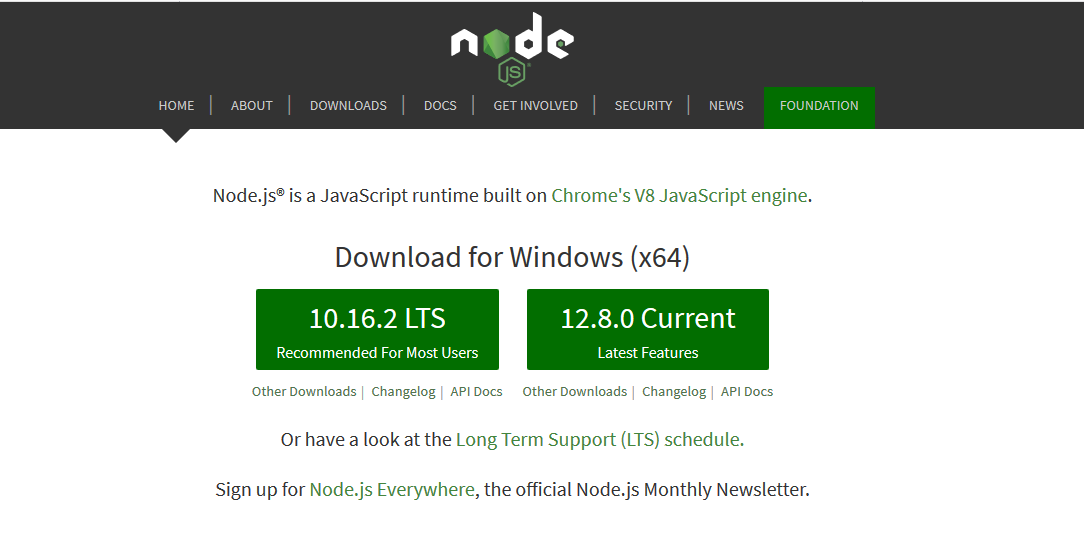
Once you install this, open command prompt on your windows machine and execute the command "node -V". I have installed the version 10.16.1, you might have different version if you are installing this at a later point in time.

ensure npm is added in the PATH variable in your system environment variable.

Once this is done open a new command prompt and enter the command 'npm' and you should be able to see the below output on usage. If you do not get this, please ensure the PATH variable is correct, in some cases restart of windows resolves this issue.

b) Installation pbiviz library -
open command prompt and execute the below command -
npm i -g powerbi-visuals-tools
open command prompt and execute the below command -
npm i -g powerbi-visuals-tools
In this command: i stands for install and -g stands for global which ensures it is available throughout the system and not restricted to the folder in which you have downloaded it.
once this is done execute 'pbiviz' in command prompt and you should be able to see the image below.

c) Installation of certificate -
We need to install the certificate. To do this follow the steps below -
Step 1 - open command prompt and execute the command - 'pbiviz --install-cert' and copy the passphrase and you should see a window open for importing certificate.
Step 2 - Import the certificate for current users and click on next

Step 3 - The certificate path would automatically be taken care of in the latest version of pbiviz.

Step 4 - Paste the passphrase which we had noted down in step 1 and click on next.

Step 5 - Leave the default selection and click on next.

Step 6 - You will be shown the summary, click on Finish and you should get a message stating import was successful.

d) creating project and opening it via visual studio code
Step 1 - We will use Visual studio code to do our coding. You can download visual studio in this link for visual studio code.
Step 2 - Create a folder and open command prompt in this path and execute the command, this will create a nodejs project with required project structure.
pbiviz new myHighChart
pbiviz new myHighChart

Step 3 - Now let us open the proejct in Visual Studio Code using the command 'code .'
First execute - cd myHighChart
Then execute - code . to open visual studio code.
First execute - cd myHighChart
Then execute - code . to open visual studio code.
Step 4 - You should be able to see the folder structure as shown in the image below. Click on View -> Terminal.

Step 5 - Install the highcharts component in the terminal which we opened in the previous step.
npm install highcharts --save
npm install highcharts --save
Step 6 - To verify the installation open the package.json file and ensure the below highlighted ones are present.

This completes the setup of environment. Now let's see how to enable the highcharts visualization in your tool.
2) Coding to add highcharts -
Step 1 - Open src > visual.ts and you should be able to see that microsoft already has provided you a default code which renders a sample visualization as shown in the image below. You can go ahead and check it out, but I will leave that to your interst.
Step 2 - Code:
Add the below import statements:
In the constructor you only need the below code:
The update function needs to like this -
You can leave the rest as it is.
The complete code is provided below.
Once this is done, on the terminal type 'pbiviz start' and you should see a message stating 'Compiled successfully'
3) Testing the visualization on the powerbi report -
To test the visualization you have to:
a) Go to powerbi <https://app.powerbi.com> and enable the developer option in settings as shown in image below
step 1-
To test the visualization you have to:
a) Go to powerbi <https://app.powerbi.com> and enable the developer option in settings as shown in image below
step 1-

Step 2-

b) Go to any report and edit it or click on any report and click on edit. Once it is done on the visualization page you should see a custom chart icon with the name as Custom Visual on hover as shown in the image below.

c) Once you are able to see the widget in this screen, click on it and add a column from your dataset into Category Data to trigger the update function which will draw the chart as shown in the image below.

d) If you want to package the visualization to be available then you need to execute: 'pbiviz package'. You will see a file and you can import this file into your powerbi desktop / portal using import from file option.
This blog shows how to add the visualization into power bi. We need to configure the properties like xaxis, measure, series, legend etc. Do let me know if you want me explain that, I can write subsequent blogs on the same.
This blog shows how to add the visualization into power bi. We need to configure the properties like xaxis, measure, series, legend etc. Do let me know if you want me explain that, I can write subsequent blogs on the same.
Great article ! thanks for the simple and clear explanation
ReplyDeleteActually, properties config especially series would be super helpful!
Sure will try and do in coming days
DeleteThis is great. Are we able to map the chart to data within the PowerBI report itself?
ReplyDeleteYes you can, Microsoft has given documentation on how to populate the properties on the power bi so that people can drag and drop the data points and generate charts
ReplyDeleteThis comment has been removed by a blog administrator.
ReplyDeleteI think Power BI is the most useful business analytic tool to provide solutions and create reports for end users.
ReplyDeletePowerbi Read Rest
Could you provide an example of how to replace the static data with user-defined time-series data?
ReplyDeleteYs, I am interested in that too.
DeleteThis comment has been removed by a blog administrator.
ReplyDeleteHow do I trigger Certificate Import wizard?
ReplyDeleteI have followed the article. When I open Power BI Desktop I dont see the custom visual icon. Any idea why?
ReplyDeleteThis comment has been removed by a blog administrator.
ReplyDeleteVery nice article,Thank you for sharing!!
ReplyDeletemsbi online training
msbi developer course
Very nice post here thanks for it I always like and search such topics and everything connected to them.Excellent and very cool idea and the subject at the top of magnificence and I am happy to comment on this topic through which we address the idea of positive re like this.
Msbi Online Training India
msbi developer course
P0wer bi training
ReplyDeleteP0wer bi online course
Thanks for your information.very good article.
ReplyDeletePower BI Online Training
Power BI Online Course
Usually I do not read post on blogs, but I would like to say that this write-up very forced me to try and do it! Your writing style has been surprised me. Great work admin.Keep update more blog.Visit here for Product Engineering Services | Product Engineering Solutions.
ReplyDeleteIT's very informative blog and useful article thank you for sharing with us , keep posting learn more about Product engineering services | Product engineering solutions.
ReplyDeleteYeni Perde Modelleri
ReplyDeletenumara onay
mobil ödeme bozdurma
nft nasıl alınır
Ankara evden eve nakliyat
trafik sigortası
Dedektor
KURMA.WEBSİTE
Ask romanlari
Valuable perspective on the rising importance of business intelligence in today’s data-centric world! To transform complex data into meaningful business insights, it’s essential to Hire Power BI Developers with the right skills. HireFullStackDeveloperIndia provides experienced BI professionals to help maximise the value of your data analytics initiatives.
ReplyDeleteGreat insights on integrating Highcharts with Power BI! For businesses looking to implement advanced custom visualizations seamlessly, partnering with experts is crucial. You can HireFullStackDeveloperIndia to ensure smooth development, optimal performance, and a tailored analytics experience.
ReplyDelete